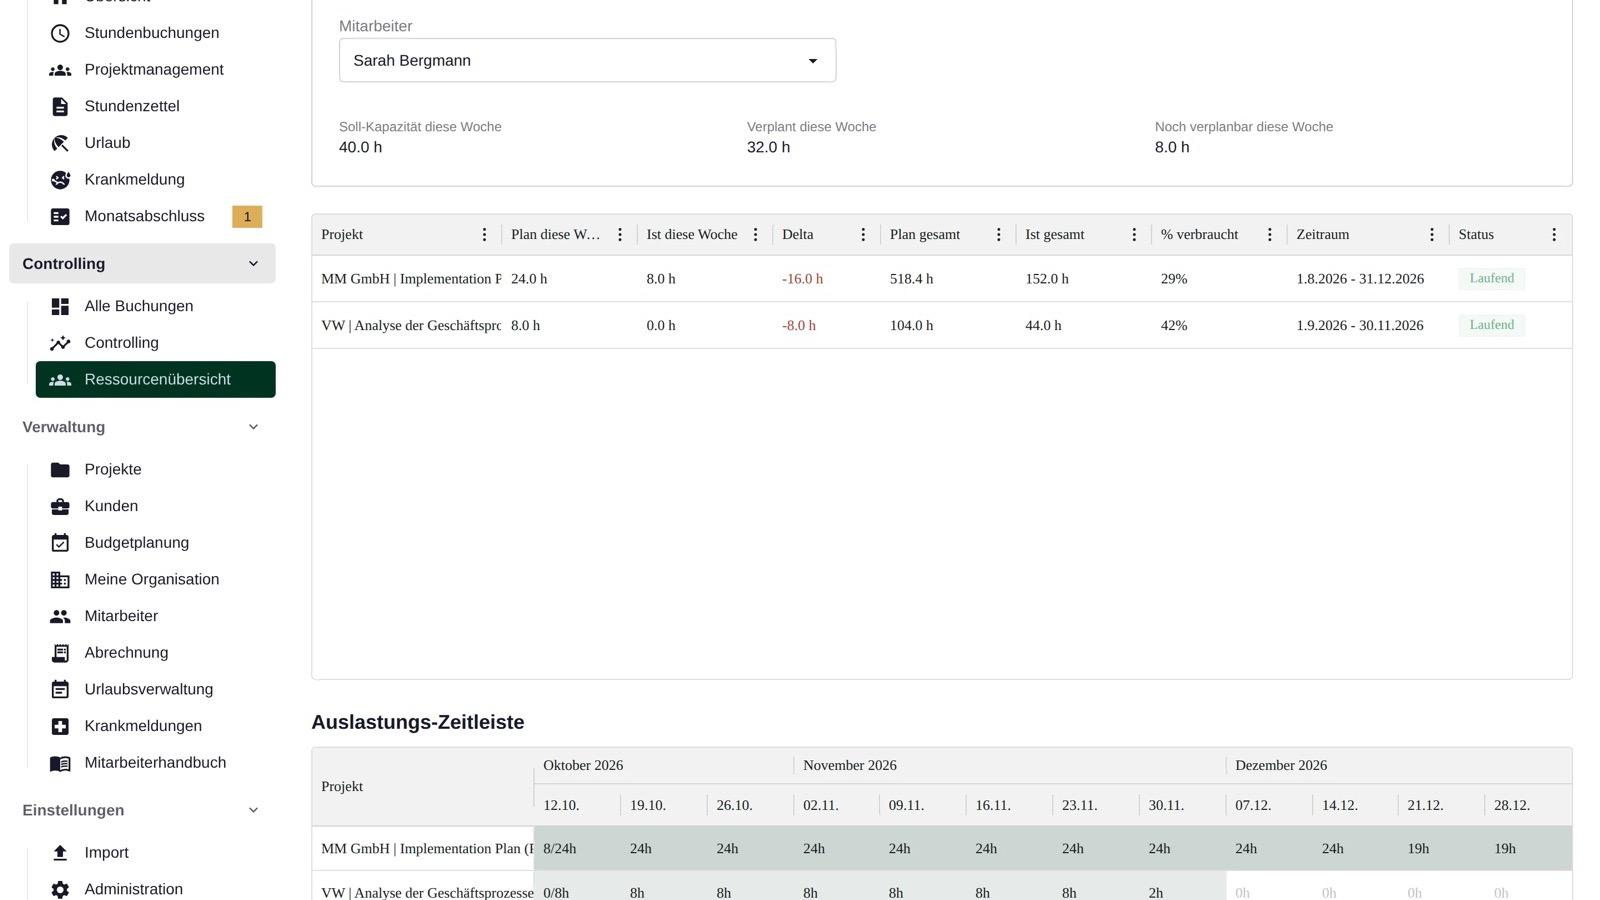
In consulting firms and other project service businesses, future revenue depends on which employees work on which projects and at which rates their work is invoiced. Personnel costs continue even when a project starts later or a follow-up order is missing.
A forecast brings this information together into a projection. Actuals to date can be extrapolated to the full year or combined with the plan for the coming months. The two methods provide different information and can complement each other.
QUANTICAL.ERP provides two views for this: Forecast for the linear projection and PLAN for combining actuals to date with future project assignments.
What a forecast in project business shows
A forecast describes what revenue and what result can be expected for a given period based on current knowledge. It is often calculated to year-end. A single quarter or the next twelve months can also be considered.
Target, results to date and current expectation must be kept apart:
| Term | Meaning |
|---|---|
| Plan or budget | The targets set and resources allocated for a period |
| Actuals | The work, revenue and costs recorded for the period already past |
| Forecast | The current projection for the entire period under review |
An annual budget may, for example, plan €2m in revenue, while the forecast in May only points to €1.85m. The difference is €150,000. The project plan can be used to examine whether orders are missing, projects start later or less work is called off than planned.
For time-and-materials projects, expected service revenue can be derived from billable hours and the agreed rates. For fixed-price projects, the agreed revenue and the remaining effort have to be considered instead.
Time booking, invoicing and receipt of payment are different processes. A revenue forecast therefore does not replace liquidity planning.
Method 1: Run-rate projection from actuals
The simplest method extends the figures to date to the full year. It shows the annual value that results if the average development so far continues.
Annual projection = actuals up to the cut-off date ÷ calendar days elapsed × calendar days in the year
A consulting firm with ten consultants has reached actual revenue of €640,000 up to and including 30 April 2026. 120 calendar days have passed since the start of the year. The projection is:
€640,000 ÷ 120 × 365 = €1,946,667
If the average course stays the same, this gives annual revenue of roughly €1.947m. In a leap year, use 366 days. What matters is using the same period in numerator and denominator.
The same calculation can be used as a first approximation for ongoing personnel costs. Changes already known, such as new hires, salary increases or one-off payments, then have to be taken into account. Fixed annual costs, for example for rent, software and insurance, can be included directly at their annual amount.
The projection does not need a maintained project plan. It is therefore available even when employees book their time reliably but future assignments are not yet fully planned.
Its informative value depends on how representative the period to date is. A particularly strong first quarter is extended just like a weak start to the year. Project end dates, planned absences or a changed headcount are not reflected by pure extrapolation.
The Forecast view in QUANTICAL.ERP
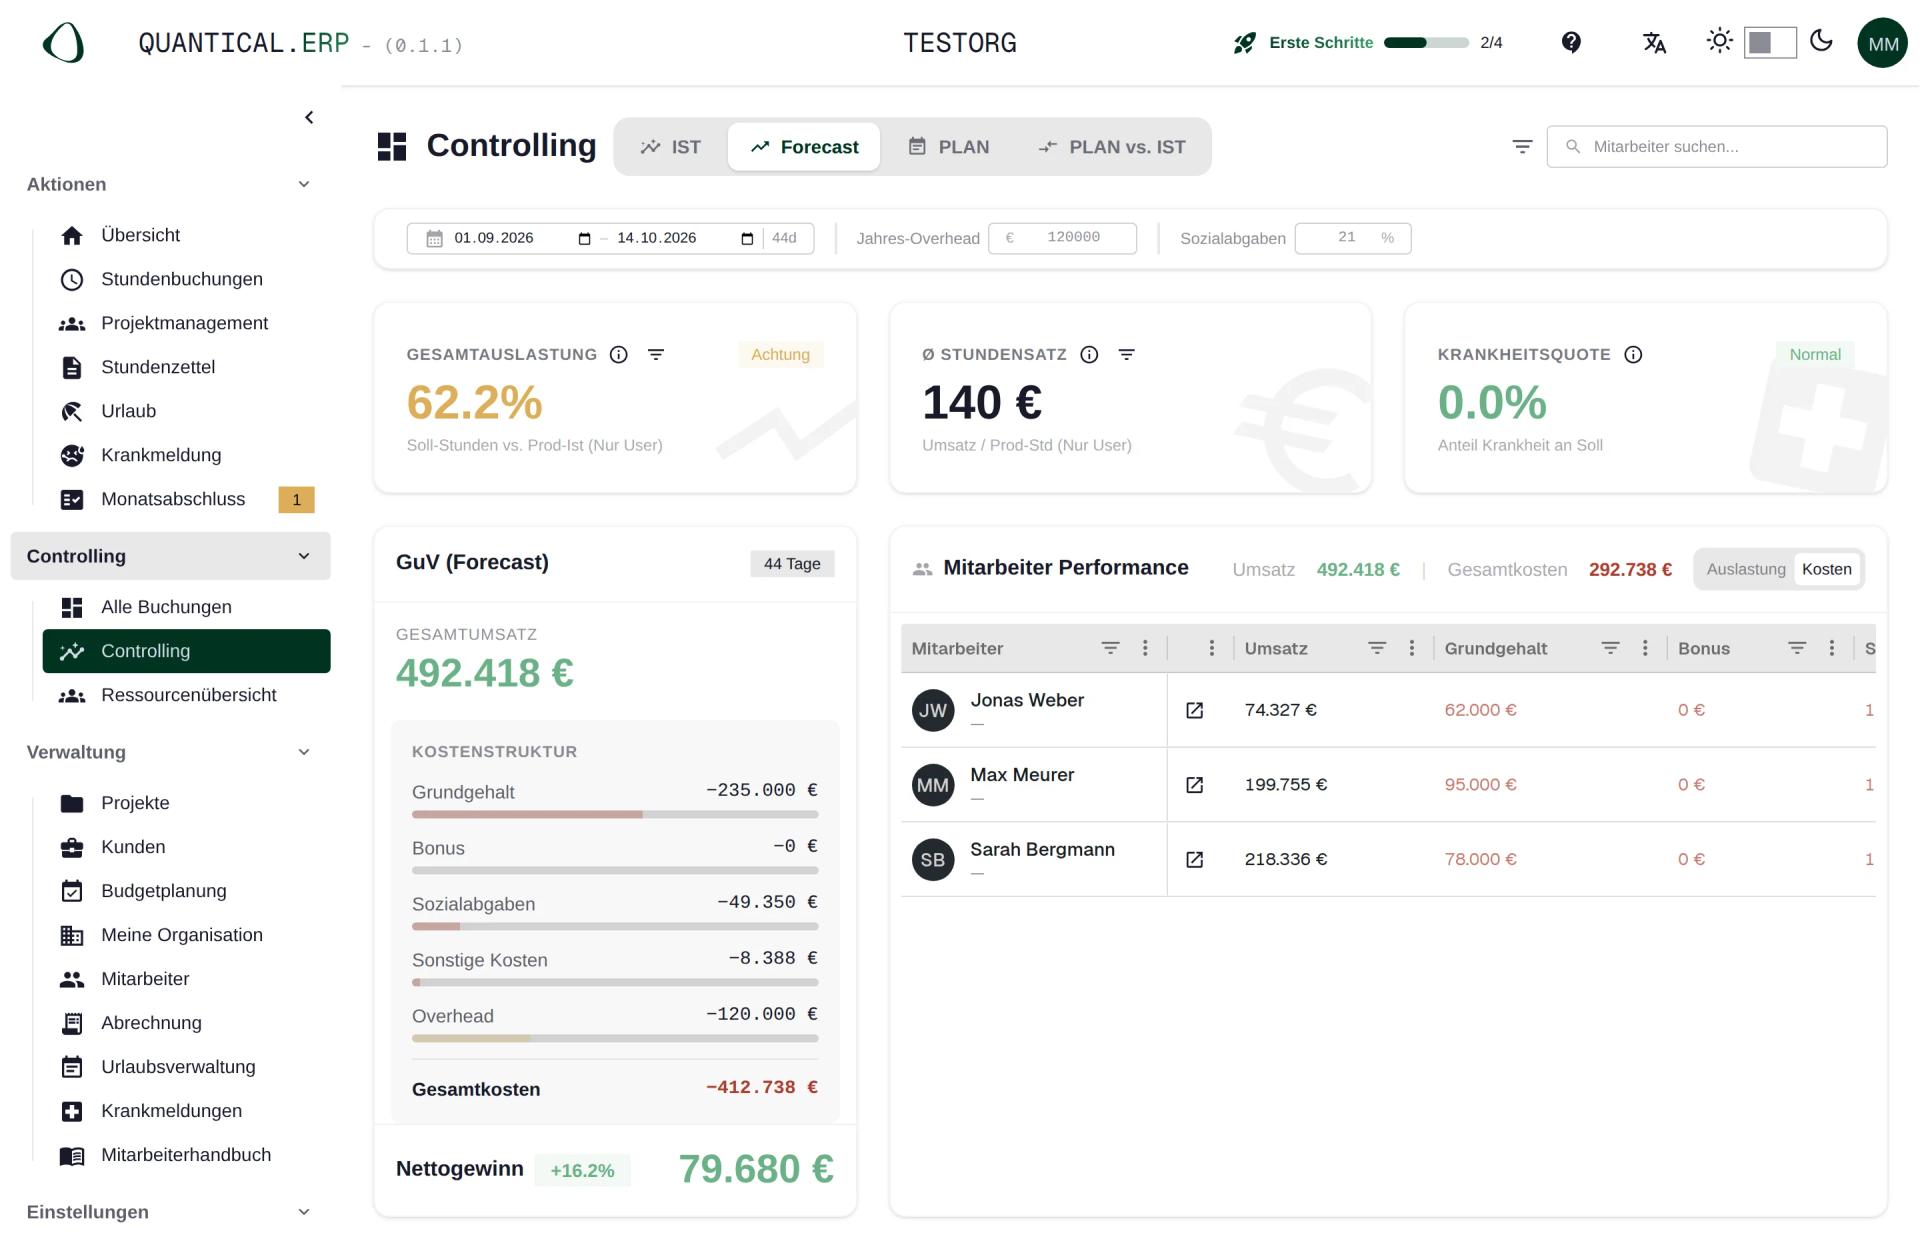
In QUANTICAL.ERP, the Forecast view in Controlling extends actuals to date linearly to the full year. The stored annual overhead is included in full.
Revenue and costs therefore sit in the same income statement. Management can follow the projection based on current time bookings without compiling a separate spreadsheet every month.
How each view calculates is described in the Controlling documentation.
Method 2: Forecast from project planning
The second method combines the past with the expected work of the coming months. Actuals are used for the completed period. For the remaining period, the planned billable work is valued.
With a single hourly rate, the simplified formula is:
Annual forecast = actual revenue up to the cut-off date + planned billable person-days in the rest of the year × hours per person-day × hourly rate
With different rates, future revenue is calculated per employee, project and period and then added up.
The same firm has planned 950 billable person-days on client projects from May to December. In the example, one person-day equals eight hours and the hourly rate is a uniform €150.
950 person-days × 8 hours × €150 = €1,140,000
Together with the €640,000 to date, this gives:
€640,000 + €1,140,000 = €1,780,000 annual forecast
| Calculation | Expected annual revenue |
|---|---|
| Linear projection from actuals to date | €1,946,667 |
| Actual revenue plus planned work in the rest of the year | €1,780,000 |
| Difference | €166,667 |
In this example, project planning gives a value roughly €167,000 lower. On review, two projects end in September and no follow-up projects have been assigned yet.
The difference alone is not yet a sales target. With an annual target of €2m, the gap to the plan-based forecast is €220,000. Whether new orders are needed for this or missing assignments first have to be entered follows from reviewing the projects.
Accounting for costs in the rest of the year
For the profit forecast, past and future costs are deducted from expected revenue. These include in particular salaries, employer contributions, variable pay, third-party services and overhead.
Personnel costs must not be applied only to planned employees. Salaries also accrue in weeks without billable project assignments. Planning gaps can therefore worsen the result considerably.
The informative value of this method depends on how complete the project plan is. A commissioned project without assigned person-days is missing from the calculation even though an order exists. Conversely, planning does not make an unconfirmed order binding.
The PLAN view in QUANTICAL.ERP
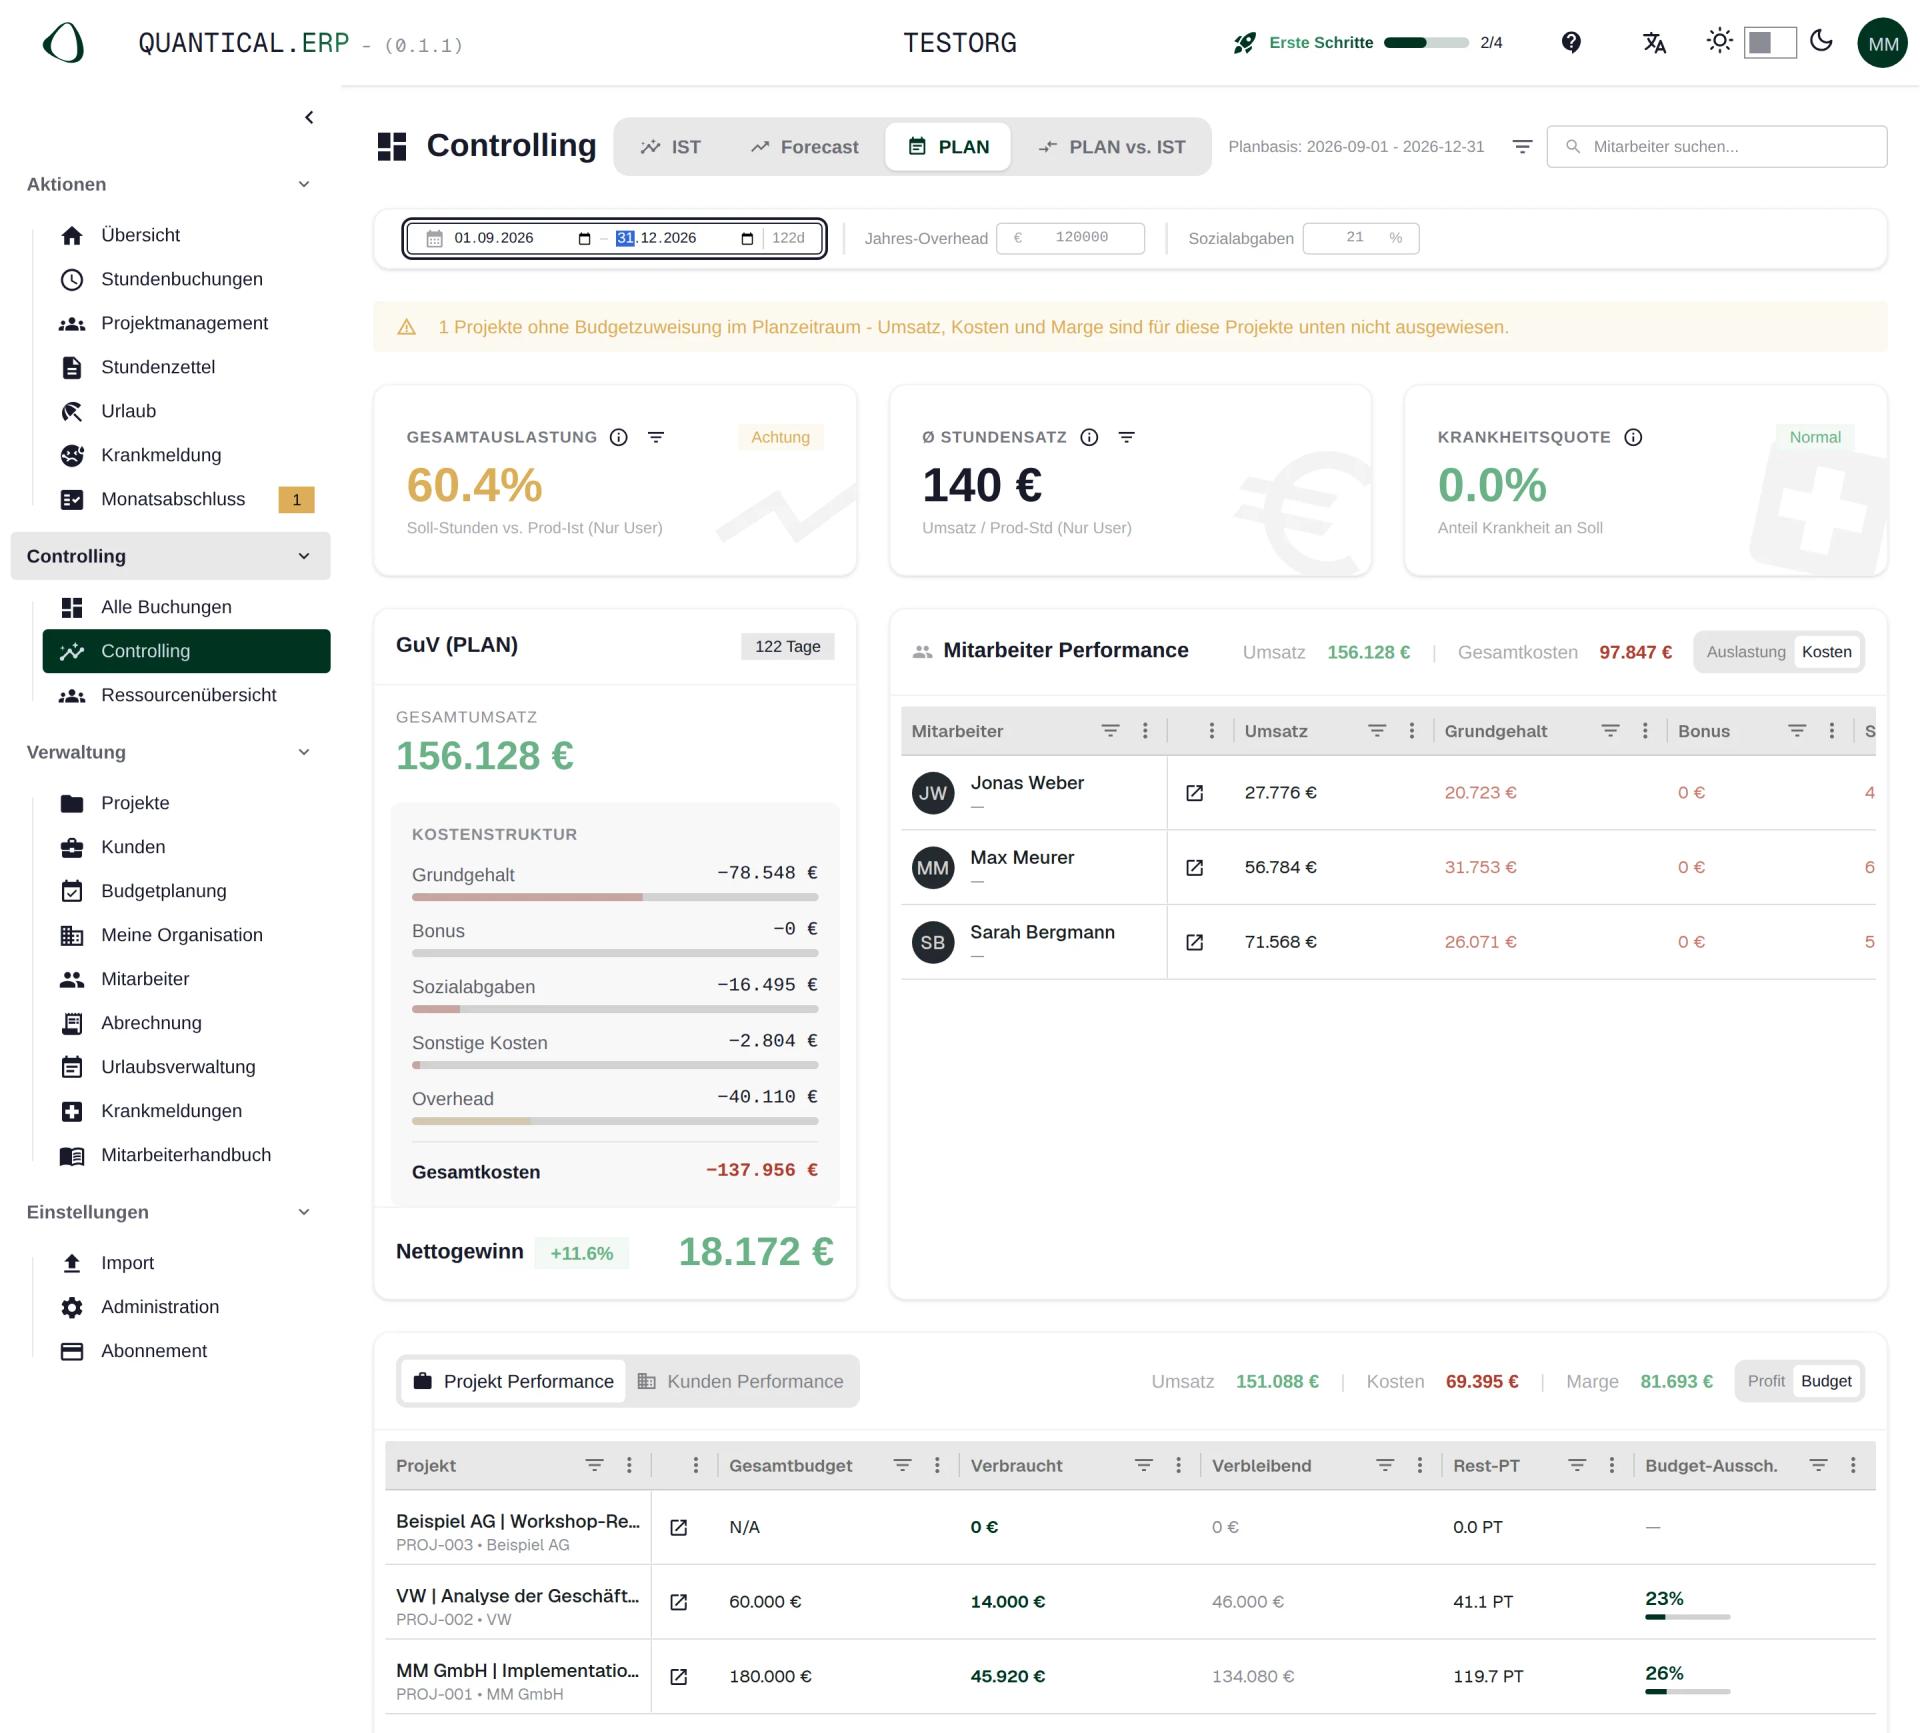
The PLAN view in QUANTICAL.ERP combines actuals from the past with planned work in the future. It is based on the person-days per week assigned in budget planning. These are valued at eight hours and the stored hourly rate.
A notice above the key figures shows projects without a budget assignment. This helps to distinguish a genuine gap in orders from planning that is still incomplete.
Planning and reporting use the same employee, project and time data. There is no need to merge a planning spreadsheet with time tracking.
More information is available in budget planning and on the capacity planning page.
Which method makes sense when?
The linear projection shows the annual value that development so far suggests. The plan-based forecast also takes into account which work is planned for the coming months.
| Starting point | Suitable view |
|---|---|
| Time bookings are complete, future assignments are not yet fully planned | Projection as a first orientation |
| Project end dates, extensions or staffing changes are already known | Forecast from project planning |
| Business runs fairly evenly over the year | Check both values for larger differences |
| A few large projects account for a significant share of revenue | Also look at individual projects and their duration |
| The year has only just started | Treat the projection with caution and add specific orders and planning |
If both values are close, development so far and future planning fit together arithmetically. That does not yet confirm that all assumptions are right.
If the plan-based value is clearly lower, orders or assignments may be missing. Leave, ending projects or lower rates can also explain the difference. If it is higher, check whether more billable work really is planned and whether the available employees can deliver it.
Looking at the sales pipeline as well
Proposals not yet commissioned can make up a significant part of expected business in the second half of the year. Unless they are already included in a plan, they do not appear in either of the two calculations described.
A complementary view is the weighted pipeline:
Weighted proposal volume = proposal volume × probability of winning
A proposal worth €200,000 with an assumed 50% probability of winning gives a weighted value of €100,000. This is a statistical expected value. The individual order may be won in full or lost entirely.
For an annual forecast, it also matters which part of the work can still be delivered within the year under review. An order worth €200,000 that only starts in December does not automatically add the same amount to the annual projection.
QUANTICAL.ERP does not manage a sales pipeline. Proposals and win probabilities can be assessed in a CRM or a supplementary spreadsheet and viewed alongside the forecast. The same order must not be counted both as a planned project and again as a pipeline contribution.
How accurate was the forecast?
To check the quality of a forecast, the forecast as it stood at the time must be kept. A calculation updated today cannot be assessed retrospectively as the forecast from the start of the year.
For a completed period, the variance can be calculated as follows:
Variance in percent = (actuals − forecast at the time) ÷ forecast at the time × 100
If the forecast for the first quarter was €480,000 and actuals later came to €450,000, the variance is:
(€450,000 − €480,000) ÷ €480,000 × 100 = −6.25%
The result is therefore 6.25% below the forecast at the time. With a forecast of zero, this percentage calculation is not possible; the absolute difference is used instead.
For the next forecast, the cause of the variance is decisive. A later project start calls for a different adjustment from a lower billing rate or incomplete time booking.
PLAN vs. ACTUAL in QUANTICAL.ERP
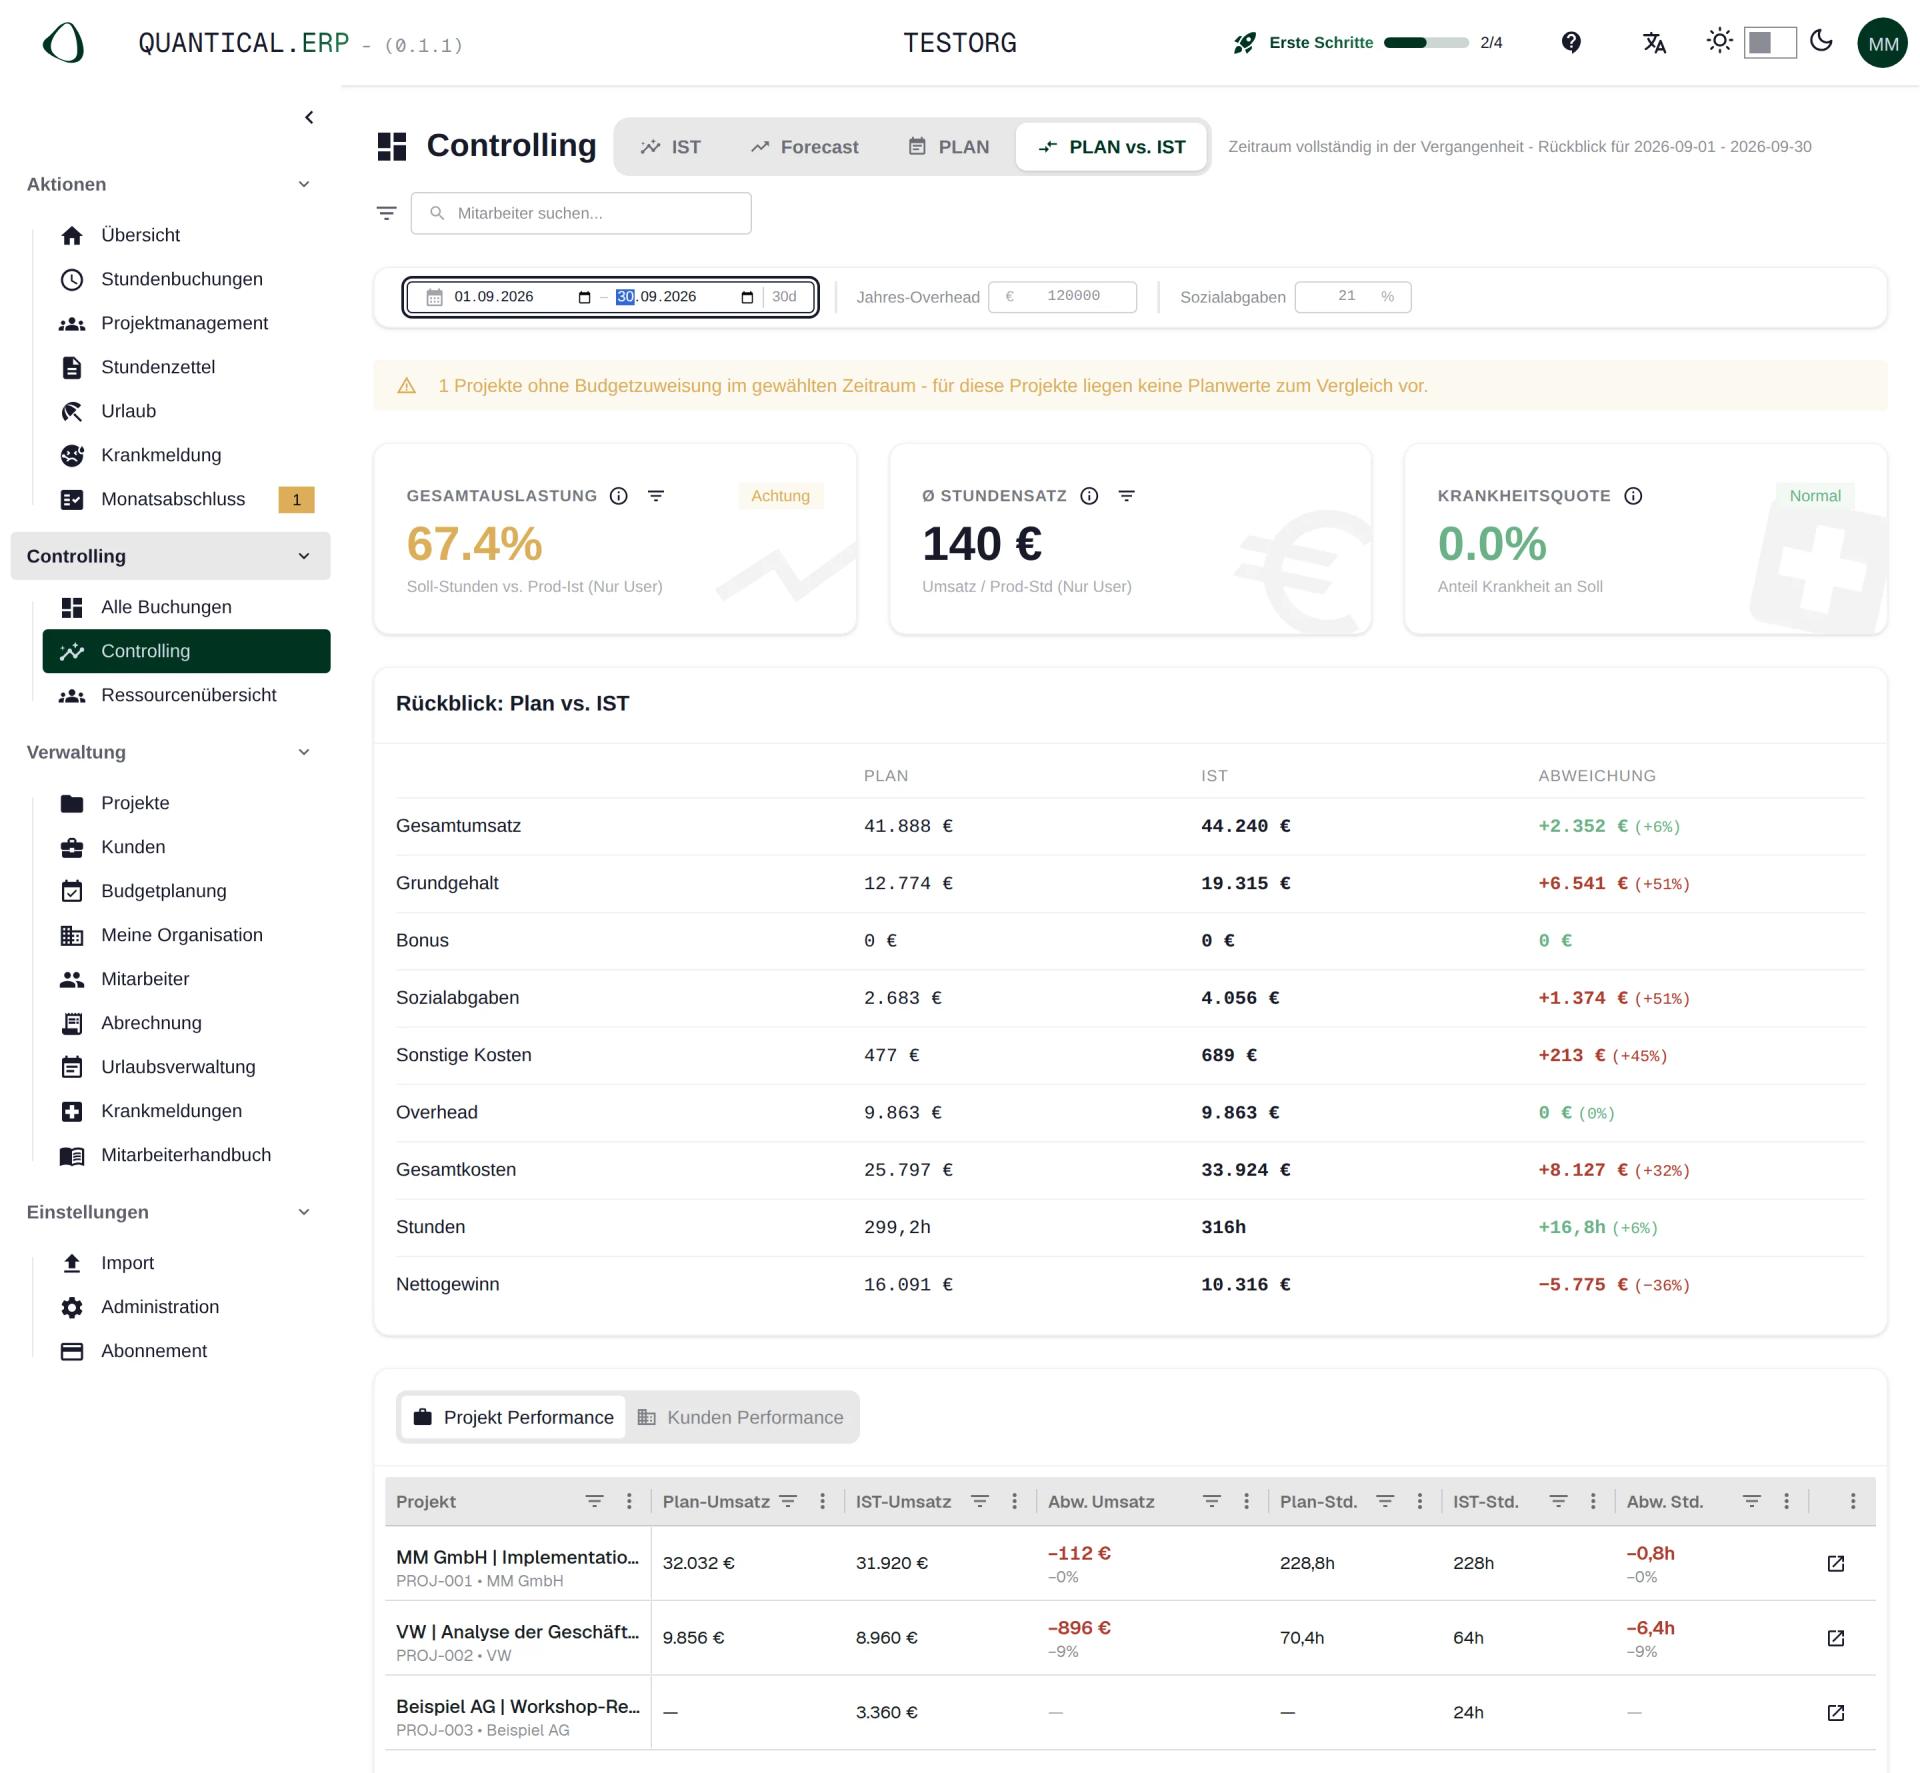
For completed periods, the PLAN vs. ACTUAL view compares plan and actual values per cost type and project. This makes it possible to examine where actual development departed from the plan.
This comparison supports root-cause analysis. To check an earlier forecast, its state at the time must also be documented.
Updating the forecast monthly
A monthly rhythm combines current time bookings with a manageable planning routine:
- Complete and check the previous month’s time bookings.
- Update project assignments, extensions, absences and known cost changes.
- Compare the projection and the plan-based forecast; look at the pipeline as well.
- Explain changes from the previous month and document the new forecast.
QUANTICAL.ERP provides the projection and PLAN within the same Controlling. Reporting builds on the bookings and assignments already needed for project administration. How much reconciliation is then required depends on how complete this data is and on the variances found.
Year-end forecast or rolling forecast?
A monthly updated projection to 31 December remains a year-end forecast. A rolling forecast, by contrast, has a constant horizon, for example the next twelve months. In November it therefore reaches October of the following year. The annual views described are to be distinguished from it. Background: Lucerne University of Applied Sciences, Rolling Forecast and Rolling Budget (German).
Common calculation mistakes
A common mistake is using list prices. For the forecast, the rate actually agreed counts, including discounts and its period of validity. How to calculate a cost-covering rate is shown in the article How to calculate a consulting day rate.
Missing absences also distort the plan. Leave, public holidays and part-time work change available capacity. Which months are particularly affected depends on the location and the team’s actual holiday periods. Which systems take absences into account in capacity automatically is shown in the comparison of resource planning software.
In a profit forecast, cost changes are also easily overlooked. New hires, salary increases, bonuses and additional third-party services must be taken into account even if expected revenue stays the same.
Finally, the forecast should be calculated independently of the annual target. A variance from the budget is information for steering. It does not disappear by adjusting the forecast to the desired value.
Frequently asked questions about forecasting in project business
What data is needed?
The projection needs complete actuals for the period to date. The plan-based forecast also needs future billable work and valid rates. A profit forecast additionally takes personnel, project and operating costs into account.
From when is a projection meaningful?
There is no fixed point in time. What matters is whether the period to date is representative of what follows. A few large projects, seasonal fluctuations or a changed headcount can distort a linear projection even after the first quarter.
Is Excel enough for a forecast?
A linear projection can be built with a simple formula. More maintenance arises when future project assignments, absences, different rates and cost changes have to be brought together. You then have to make sure all spreadsheets use the same data.
Is a forecast from project planning secured revenue?
It shows the revenue resulting from the planned work and the stored rates. How binding this value is depends on the orders, the billing terms and actual delivery.
What is the difference between Forecast and PLAN in QUANTICAL.ERP?
Forecast extends actuals to date linearly to the full year. PLAN adds the work from future project assignments to actuals to date. The two views offer different perspectives on the same company data.
Using projection and project planning in QUANTICAL.ERP
QUANTICAL.ERP combines project time tracking, capacity planning and controlling. The linear projection and the PLAN view are available in the same system. Project assignments and time bookings do not first have to be gathered from separate applications.
The software is developed by the consulting firm rwQUANTICAL GmbH and used there in production. Experience from project business flows continuously into further development.
QUANTICAL.ERP can be tested free for 90 days. After that, all own features cost €12.90 per user and month plus VAT. Future own features, updates and product versions are included in the single plan.
Try QUANTICAL.ERP free for 90 days
All numerical examples are our own model calculations. Amounts are net. The eight hours per person-day are the unit of this example and of the PLAN view described.